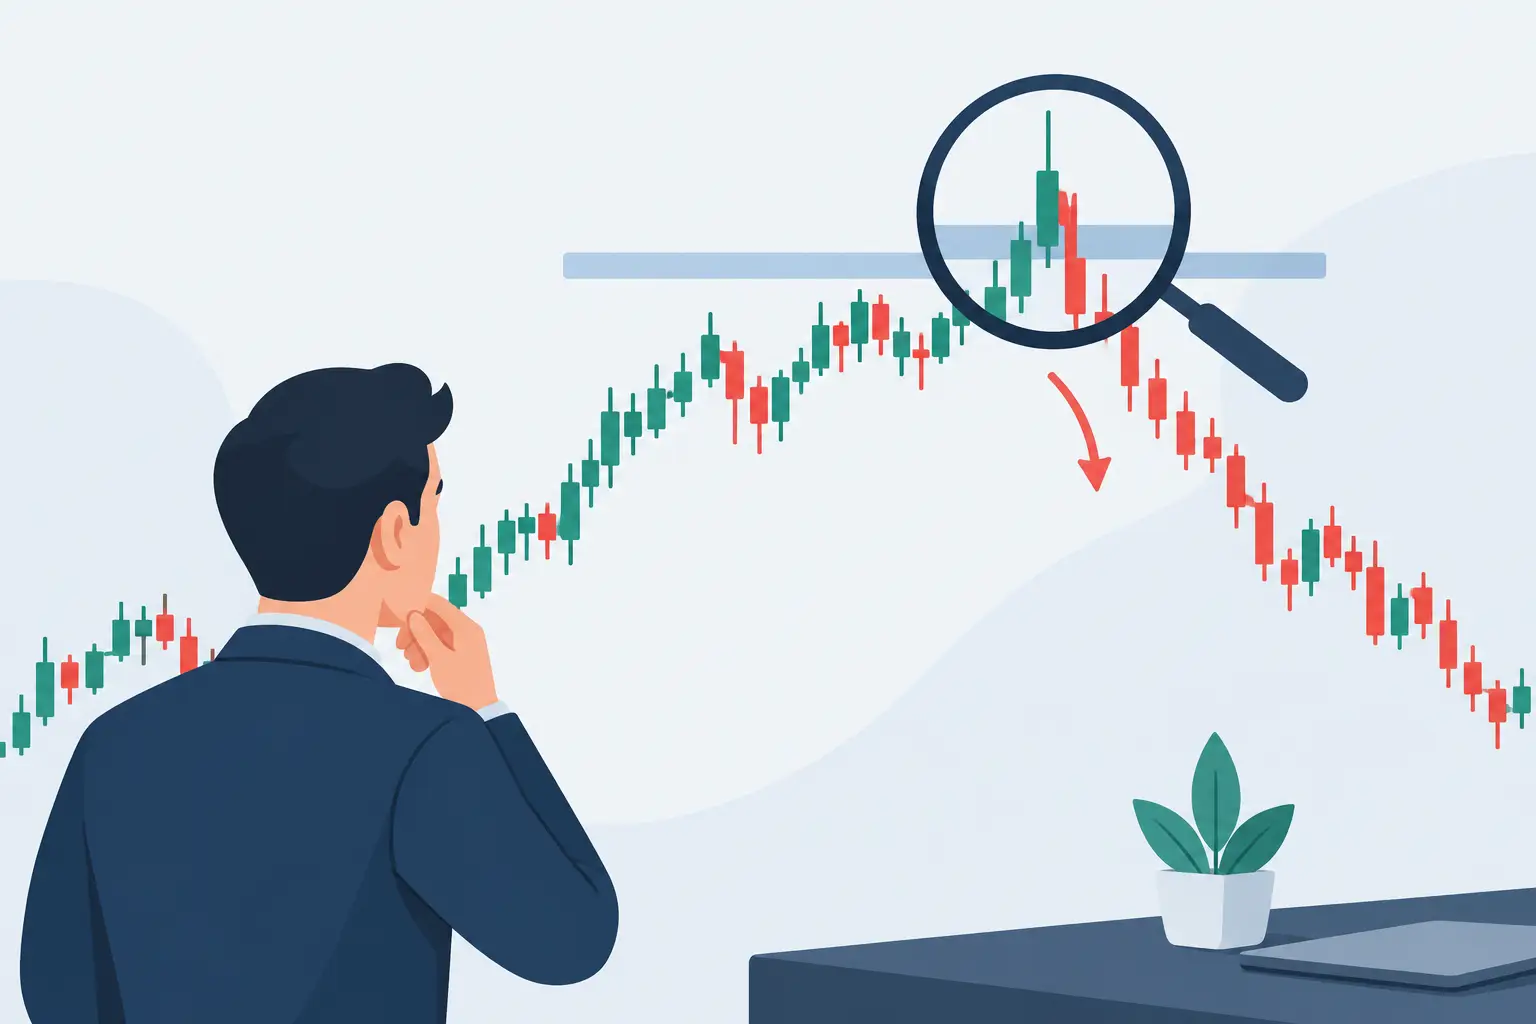
A trade outcome example is useful only when it shows the full decision chain, not just the chart after a winning move. The real value is seeing what was known before entry, where risk was defined, what would invalidate the setup, and why the trade was closed. That is how a result becomes a repeatable process rather than a screenshot.
This hypothetical premarket scenario uses simple numbers for education. It is not a recommendation to buy or sell any stock. Actual fills, liquidity, spreads, halts, news, and individual risk tolerance can materially change a trade.
The Setup Before the Open
Assume a stock, ABCD, closes the prior day at $4.80. Before the market opens, the company releases a credible earnings update and raises forward guidance. By 7:01 AM ET, ABCD is trading at $6.10, up roughly 27%, with 1.4 million premarket shares traded.
The gap alone is not the setup. Many stocks gap on news and then fade immediately. The trader needs evidence that buyers are still active and a price area where the premise can be tested with defined risk.
In this example, ABCD makes a premarket high of $6.35, pulls back, and holds above $5.90. It then builds a tight range between $6.00 and $6.15 while volume remains elevated. The key levels are clear: $6.35 is the premarket high, $6.00 is nearby range support, and $5.90 is the level that would weaken the bullish structure.
The planned idea is not to chase the first spike. It is to participate only if ABCD reclaims and holds above $6.15 with volume, creating a path back toward the premarket high. The entry trigger, stop, and targets are established before the trade begins.
Defining the Trade Before the Entry
A disciplined plan might use an entry at $6.18 after a confirmed break of the range. The initial stop is $5.94, placed below the consolidation and above the deeper premarket support at $5.90. That creates $0.24 of risk per share.
The first target is $6.42, slightly above the premarket high. The second target is $6.66, which represents a larger extension if buyers continue to press after the breakout. Neither target is a prediction. They are decision points used to organize the trade.
Position size follows the stop, not conviction. If a trader has set a maximum loss of $120 for the trade, dividing $120 by $0.24 produces a maximum position size of 500 shares. A trader who cannot accept the full planned loss should reduce share size or skip the setup. Moving the stop farther away just to preserve a position changes the trade after the fact.
This is the point many trade recaps leave out. A good setup can still lose. The purpose of a stop is not to prove the trader wrong. It is to limit the cost of being wrong when the original market structure no longer holds.
Trade Outcome Example: Target Reached
At 9:34 AM, ABCD breaks through $6.15 and trades at $6.18. Volume expands compared with the prior one-minute candles, and the stock holds above the breakout level rather than immediately falling back into the range. The trader enters 500 shares at $6.18.
The stock pushes to $6.30, pauses briefly, then clears the $6.35 premarket high. At $6.42, the trader sells 250 shares at the first target. That partial exit realizes a $0.24 gain per share on half the position, or $60 before fees and slippage.
After reaching the first target, the remaining 250 shares are not automatically risk-free. The trader still needs a rule. In this example, the stop on the remaining shares is raised to the entry price of $6.18. If the breakout fails completely, the remaining position exits near breakeven, subject to execution conditions.
ABCD reaches $6.66 at 9:48 AM. The trader sells the remaining 250 shares, producing another $0.48 per-share gain, or $120. The total gross result is $180: $60 on the first partial and $120 on the second.
The dollar result is secondary to the execution. The trade worked because the stock met the planned entry condition, held the breakout, and reached both decision levels. The process did not require adding to a losing position, chasing an extended candle, or improvising a new target because momentum looked exciting.
What the Chart Does Not Show
A winning outcome can still contain execution problems. Perhaps the trader entered late at $6.25 instead of $6.18, reducing the reward relative to the original stop. Perhaps the spread widened at the opening bell, making the planned fill impossible. Perhaps the trader sold the full position at $6.42 and watched the stock continue higher.
None of those details makes the trade a failure if the trader followed the established rules. The goal is not to capture every cent of a move. The goal is to execute a plan that can be repeated across a meaningful sample of trades.
There is also a market-context question. If major indexes are selling off sharply at the open, a long breakout in a lower-priced momentum stock may carry more failure risk. If the stock has a weak catalyst, thin liquidity, or a history of halts, the same chart pattern may deserve smaller size or no trade at all. A setup is never separate from the conditions around it.
The Same Setup Can Stop Out
Now consider the other valid outcome. ABCD triggers the entry at $6.18 but cannot hold above $6.15. Volume fades, the stock rolls over, and it trades through $5.94. The stop executes near the planned level.
On 500 shares, the intended loss is approximately $120 before fees and slippage. The trader records the result, including the actual entry and exit, the reason for entry, whether the stop was honored, and any difference between planned and actual execution.
That loss does not mean the plan was defective. A premarket breakout has probabilities, not certainty. If the catalyst, volume, structure, and entry rule were all present, the trade may have been valid even though it failed. Reviewing it later should focus on process questions: Was the level clearly defined? Did volume support the break? Was the stop placed where the thesis was invalidated? Did the trader follow the plan?
The wrong response is to immediately seek another trade to recover the loss. That is how one defined loss becomes a string of impulsive decisions. The better response is to preserve capital and wait for the next qualified opportunity.
Time Is Part of the Exit Plan
A third outcome deserves equal attention: the trade does not hit a target or stop. ABCD enters at $6.18, trades between $6.08 and $6.30 for 20 minutes, and volume steadily declines. The breakout has not fully failed, but it has not produced the expected momentum either.
A time-based rule can protect focus in this situation. For example, a trader may decide that if a premarket momentum setup cannot reclaim the premarket high within a defined window after the regular session opens, the position will be reduced or closed. The exact rule depends on the setup and trading style, but the principle is consistent: capital should not remain tied up indefinitely in a thesis that is not developing.
A timeout exit might produce a small gain, a small loss, or near breakeven. That can feel less satisfying than a clean target or stop, but it is often more honest. The market did not confirm the intended move, so the trader released the position according to plan.
How to Review Your Own Outcomes
Documenting the complete trade outcome creates feedback that a profit-and-loss number cannot provide. Record the catalyst, premarket volume, key levels, planned entry, stop, targets, actual fills, and exit reason. Add a short note on whether execution matched the plan.
Over time, patterns become visible. You may find that your best trades occur when a stock holds above VWAP after the open, or that your weakest results come from entries taken before sufficient volume confirms the break. You may learn that your first target is too close, too far, or appropriate for the volatility of the stocks you trade.
Seven01 is built around this kind of accountability: one selected setup, predefined levels, and an outcome documented after the market provides the answer. Wins, stopped trades, and timeouts all belong in the record.
A clean trade journal will not remove uncertainty from premarket trading. It will give uncertainty a structure. Start with one setup you can explain before entry, risk an amount you can accept without negotiation, and let the completed outcome teach you what the next chart cannot.